ARVis
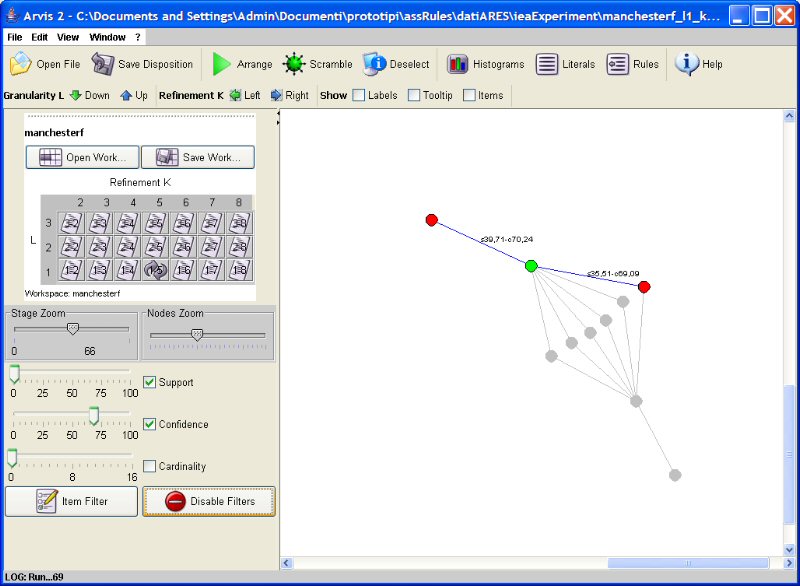
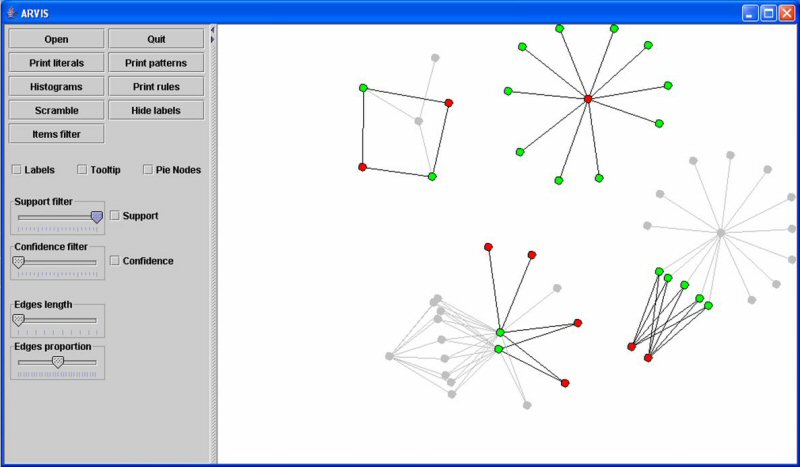
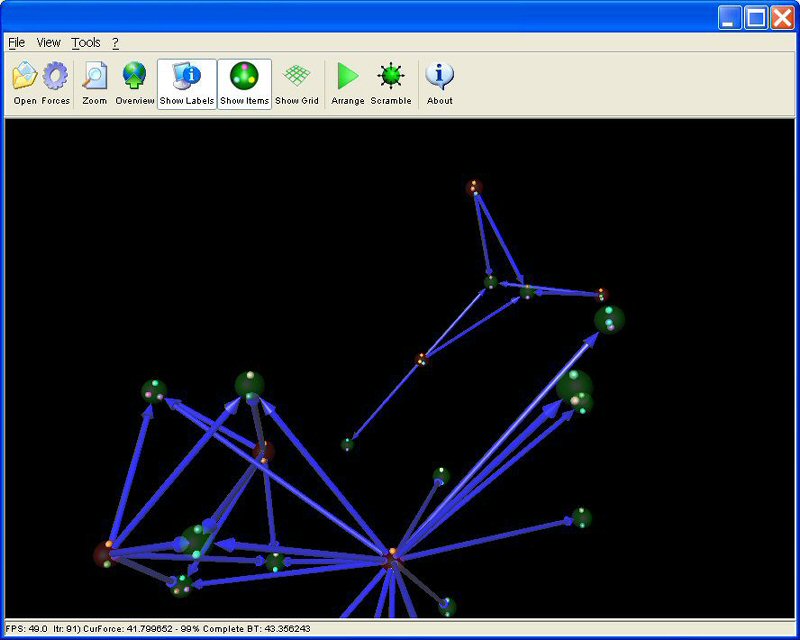
ARVis visualizes Association Rules (AR) using graphs and allows the user to interact
with them. ARVis presents the overview of the dataset, then permit the user
to zoom, filter and provides the details on
the user demand. The main user for ARVis is the data miner, and the goal is to
support the user in explorative data mining. There are two version, one exploiting
2D and another one exploiting 3D, both are shown in this page.
up
up
ARVis 2
up
ARVis
up
ARVis 3D
up
- P. Buono, Visual Data Analysis: the case of Trade Fairs, AICA 2004, 28-30 September, Benevento, Italy, pp. 733-743
- D. Bruzzese, P. Buono, Combining Visual Techniques for Association Rules Exploration, AVI 2004, 25-28 May, Bari, Italy, pp. 381-384.
- P. Buono, Analysing Association Rules with an Interactive Graph-Based Technique, Special Session on Visual Data Mining, HCI International 2003, 22-27 June, Crete, Greece, pp. 675-679.
up
up